


Election watchers are running the familiar 2026 drill. How energized are Democrats after the One Big Beautiful Bill Act? Will the president’s party suffer the usual midterm penalty? These are the right questions if you assume the eligible electorate is a fixed pool and the only thing left to predict is who shows up.
That assumption is wrong. The pool itself is shaped by who survives to Election Day, who can physically get to a polling place, and who has the bandwidth to navigate the administrative tasks voting requires. A decade of research, much of it from outside political science, has documented that this attrition is not random. It falls hardest on the low-income citizens whose participation would matter most for redistributive policy.
Javier Rodriguez calls this the missing electorate. Using ten-year mortality follow-up data, Rodriguez (2018) showed that health differences alone account for 56 percent of the participation gap between low- and high-SES Americans. Three channels compound for low-income citizens. Premature mortality removes voters outright. Chronic disease, disability, and uninsurance raise the cost of registration and the trip to the polls. And policy feedback runs in both directions: gaining Medicaid coverage in the Oregon Health Insurance Experiment raised 2008 turnout by about seven percent (Baicker and Finkelstein 2019) and losing it through Arkansas’s work-requirement waiver raised uninsurance by 4.4 percentage points (Sommers et al. 2019).
None of this has made its way into mainstream turnout forecasting. Bednarczuk’s (2024) state model in PS, the most recent serious entry, treats the citizen voting-age population as exogenous. So does most of the work it builds on. What happens if you bring the missing-electorate logic into the forecasting tradition?
The within-state finding
I built a state-by-year panel from the Current Population Survey’s Voting and Registration Supplement, covering every midterm from 2010 through 2022, disaggregated into national income terciles. I paired it with a state-level health burden index built by principal components from five indicators: under-65 mortality, infant mortality, deaths of despair, disability prevalence, and uninsurance.
Estimating the within-state effect requires care, because cross-state comparisons would confound health burden with everything else that makes Mississippi different from Massachusetts. I use a statistical technique known as “Post-Double-Selection LASSO,” and then apply state and year fixed effects, forcing identification onto the within-state movement a forecast needs.
The result is sharp and asymmetric. A one-unit rise in the state’s health burden index lowers bottom-tercile turnout by 2.14 percentage points (cluster-robust p = 0.012). The same treatment has no detectable effect on middle-tercile turnout (+0.44, p = 0.71) or top-tercile turnout (−1.15, p = 0.26). Health burden bites the participation of the income group whose participation would matter most for redistributive policy, and it leaves the rest of the electorate essentially untouched.
The same procedure on the other two terciles returns nothing, and alternative treatments yield nothing interpretable. One signal, in the place theory predicts it, where the channel is most binding.
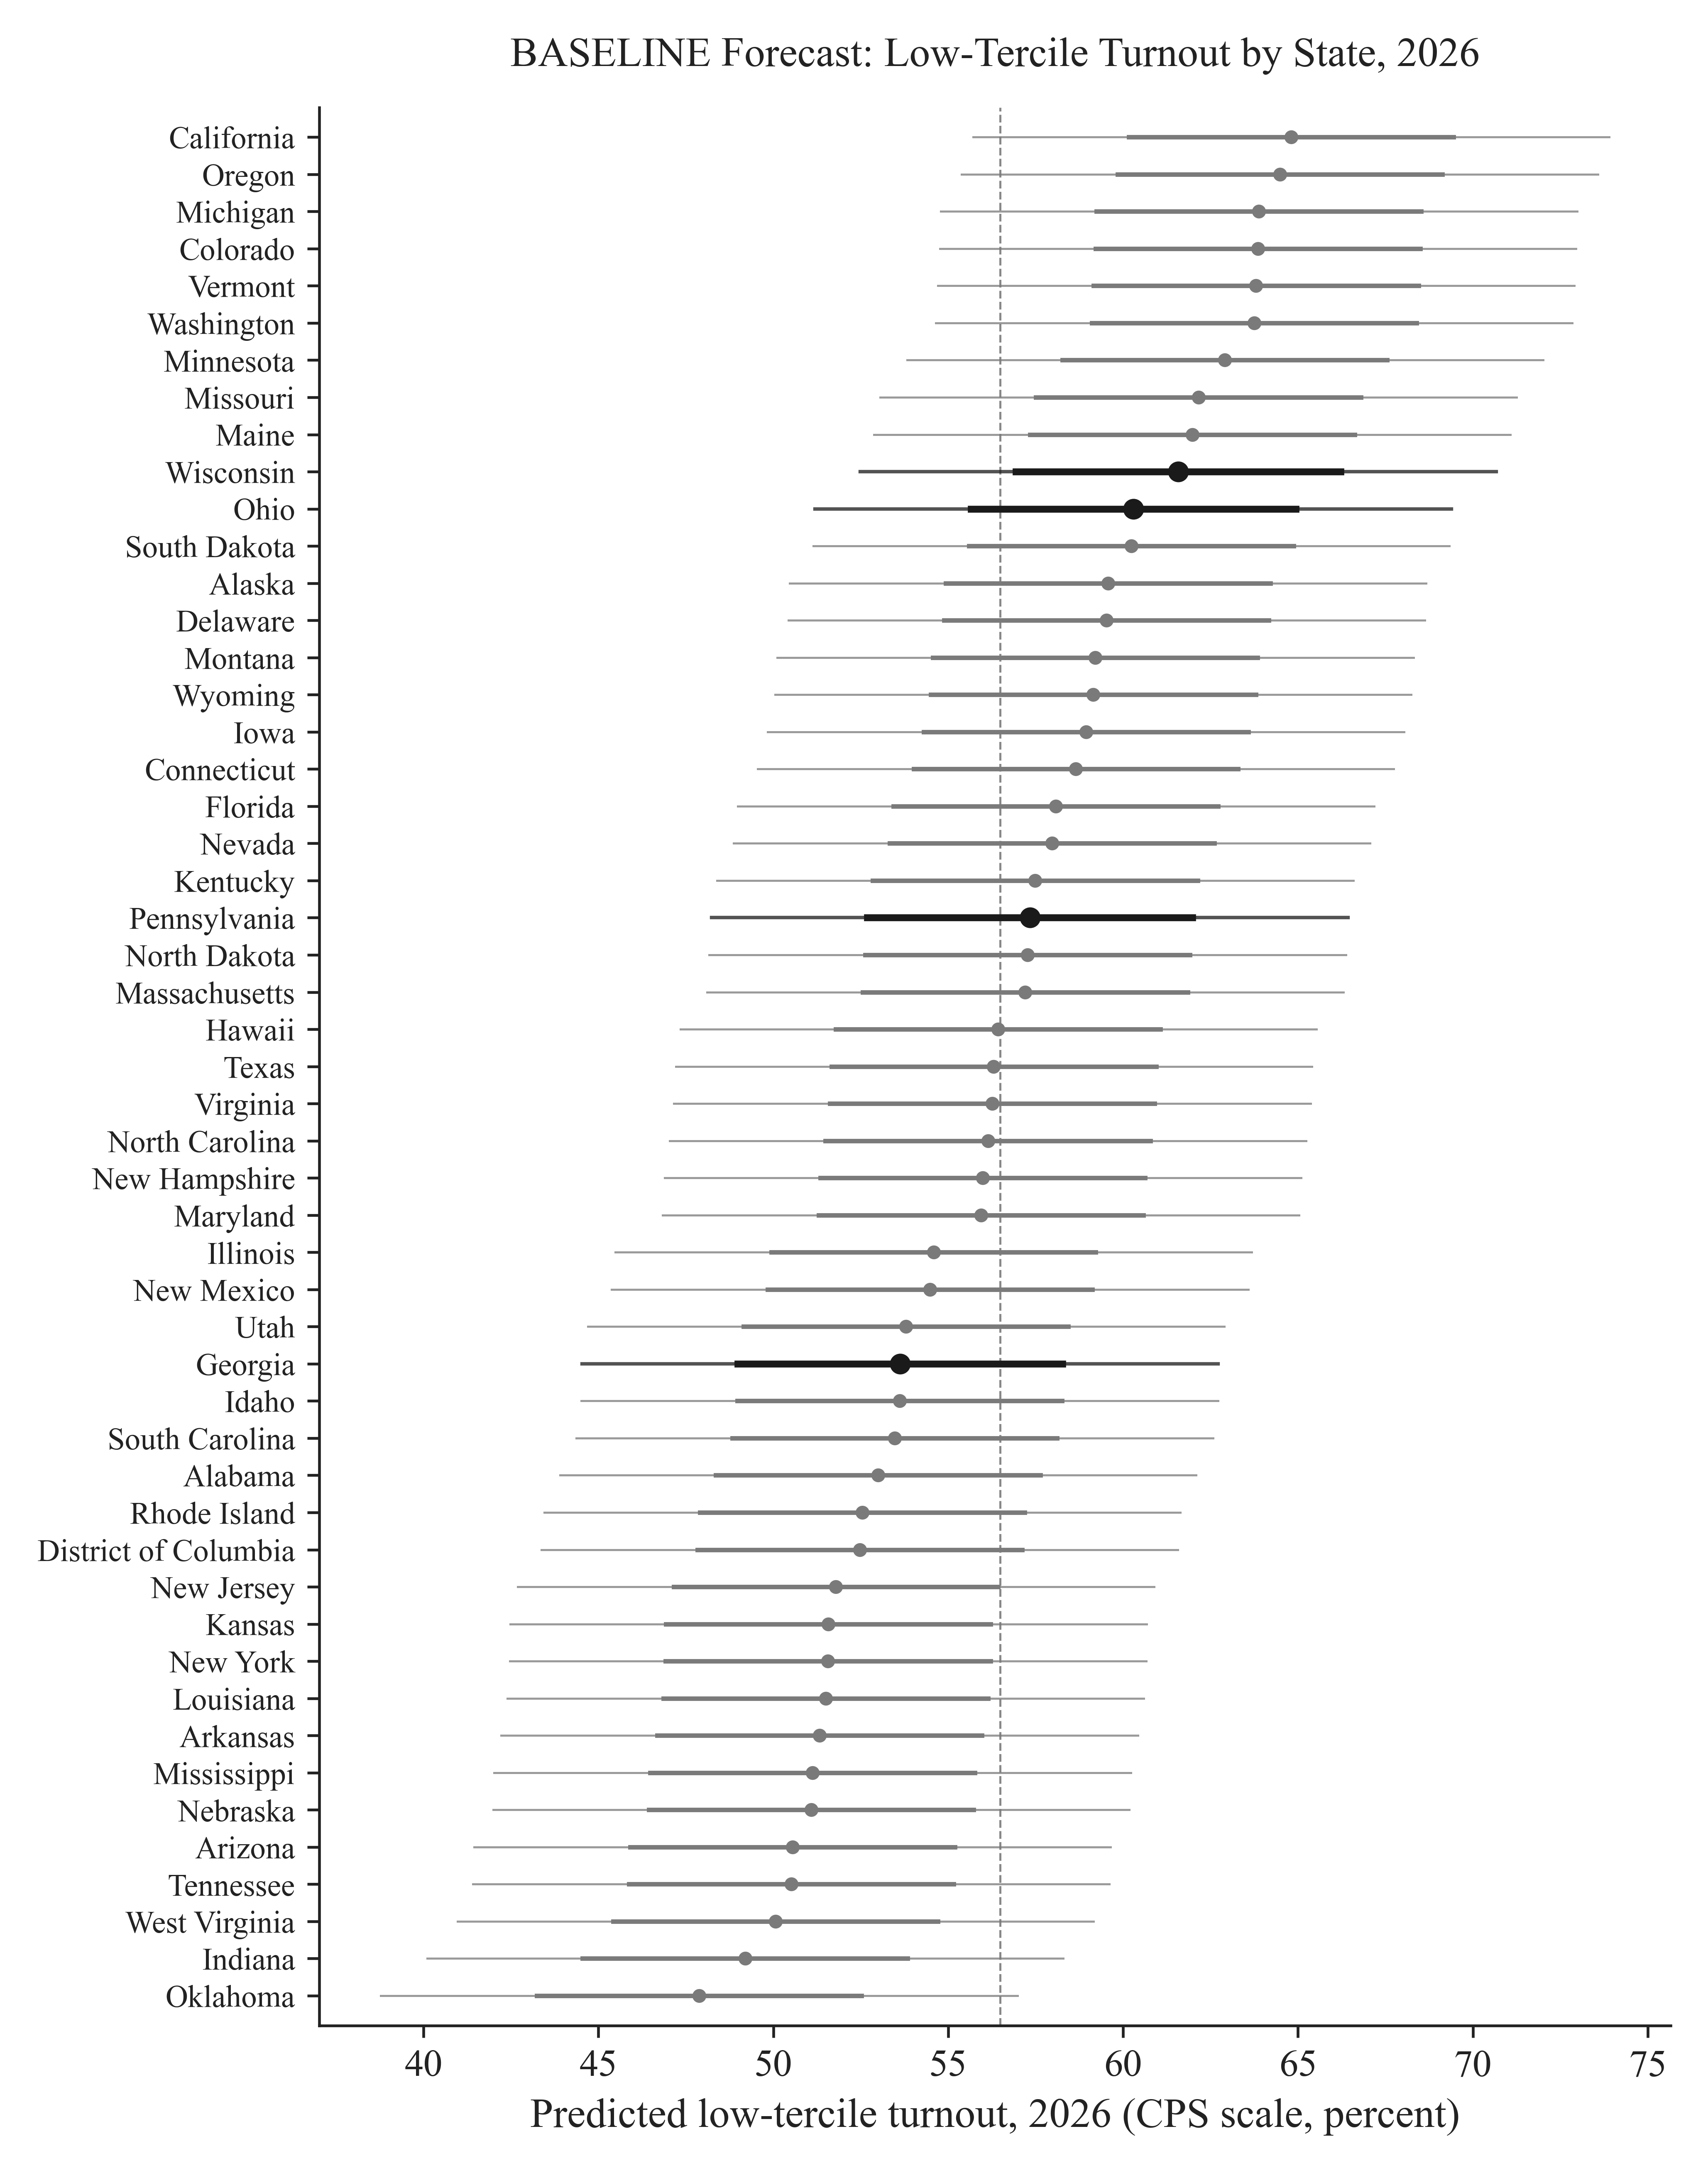
Figure 1. Baseline 2026 forecast of bottom-tercile turnout for all 51 jurisdictions, with 68 and 95 percent predictive intervals. Battleground states (GA, OH, PA, WI) drawn in black. Dashed line marks the national mean (56.5 percent). Source: author’s calculations from CPS-VRS, CDC WONDER, and ACS data, 2010–2022 midterm cycles.
What 2026 looks like
Refit on the full 2010–2022 sample, the model produces baseline 2026 forecasts for all fifty states and DC. The four battleground states: Georgia at 53.6 percent bottom-tercile turnout, Pennsylvania at 57.3, Ohio at 60.3, Wisconsin at 61.6. The within-state gap between top and bottom terciles is essentially flat across these four at 21 to 23 percentage points. Income stratification of midterm turnout is a national feature, not a regional one.
The geography of the low end is suggestive. Eight of the ten lowest-forecast jurisdictions sit in Appalachia, the Deep South, or the Mountain West. Eight of the ten highest sit on the West Coast, the northern Midwest, or New England. The mean 2022 health burden index in the bottom ten is roughly seven times the mean in the top ten.
For 2026 strategy, the bottom-tercile baseline matters more than the gap. Georgia’s low-income turnout baseline sits roughly 8 points below Wisconsin’s. The same dollar of mobilization spending reaches more non-voting low-income citizens in Atlanta than in Milwaukee.
What this does and does not say about OBBBA
The natural next question is what the One Big Beautiful Bill Act’s Medicaid contraction does to 2026 turnout in exposed states. I want to be honest about how far the evidence reaches. My index is built from mortality and morbidity and barely weights uninsurance, so the short-run insurance channel that Sommers and colleagues documented in Arkansas does not propagate cleanly through it.
What the framework does speak to is the cumulative weight of population health on participation. OBBBA’s longer-run effects on mortality, disability, and the deaths-of-despair complex will move the index. And they will move it most in states where the bottom-tercile baseline is already low. Indiana, Iowa, Kentucky, Missouri, Oklahoma, and West Virginia sit in the bottom half of the 2026 bottom-tercile forecast distribution and overlap substantially with the expansion states most exposed to OBBBA’s 90/10 federal match cut. The missing-electorate channel will widen where it is already widest.
A second finding worth surfacing
One more result from the same panel cuts against the current enthusiasm for machine-learned election forecasts. Adding the health and friction variables to a parsimonious lagged-turnout-plus-demographics model does not improve out-of-sample error on any tercile. The richer model overfits a four-cycle panel.
Identification and prediction are different inferential games, and on short panels the simple baseline is hard to beat. Forecasters reaching for high-dimensional models on the same data should expect the same outcome.
The bigger point
Treating the eligible electorate as exogenous to policy choices is a modeling convenience that the data no longer supports. Health policy is electoral policy, in the specific sense that it reshapes who is alive, healthy, and bureaucratically capable enough to cast a ballot. The 2026 forecasts I report are conservative by construction: 95 percent intervals span roughly 18 percentage points, and no plausible single-cycle policy effect will move a state outside that envelope. But the systematic pattern across states is real, and it is concentrated where the theory says it should be.
The questions election forecasters ask in 2026 should include who has remained eligible by Election Day, not just what fraction of the eligible will show up.
Jiyue Wang is an incoming political science Ph.D. student at Rutgers University-New Brunswick, researching health policy and political participation. Wang's commentary has appeared in Wisconsin Watch and the New Jersey Monitor.
